

Social Media Consumption Pattern Study
A Mixed-Methods Exploration on Behavior, Emotion & Digital Well-being

Key Insights
📱 42% spent 3+ hours/day on social media; short-form videos dominated.
😣 84% continued usage despite negative emotions (stress, comparison, distraction).
🤖 61% discovered new content via algorithms; many found it “too sticky” to resist.
🧠 Journaling increased self-awareness and led to reduced screen time in some cases.

Stage 3: Interviews
To ensure our research captured a range of experiences and backgrounds, we recruited six interview participants. Each was assigned a unique participant ID to maintain anonymity. The participants were balanced across gender, race, and occupational status, all within the 21–29 age range — representative of the core demographic for high-frequency social media users.
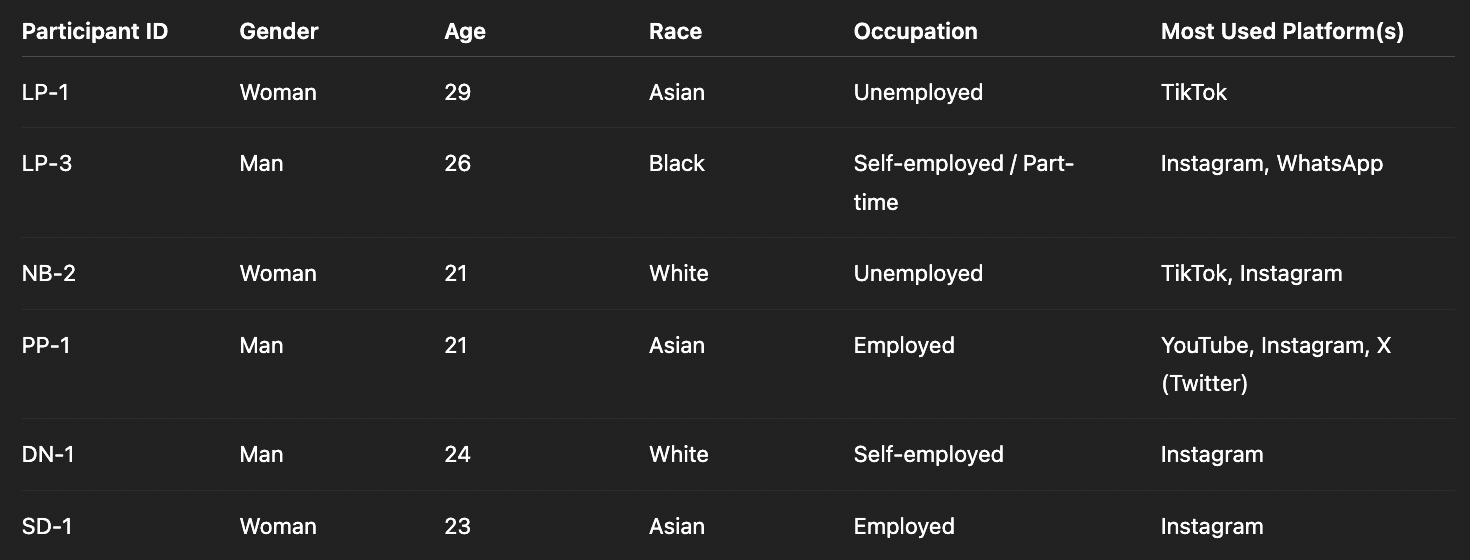
This range allowed us to analyze how employment status, platform preference, and personal context influenced mental health outcomes and platform dependency.

Collecting the Data
We launched our research in three phases:
Survey Phase
We distributed a mixed-scale survey to 43 participants, collecting data on platform use, time spent, emotional impact, content preferences, and perceptions of control. This gave us a broad, quantifiable understanding of trends and touch-points across the user journey.
Diary Study Phase
To capture in-the-moment emotions and shifts in mindset, we asked 8 participants to log their social media habits over 3–5 days. Each evening, they recorded their motivations, emotional state, content type, and reflections — giving us 27 rich entries.
Interview Phase
Building on the diary entries, we conducted semi-structured Zoom interviews with 6 participants (ages 21–29). We explored their social media triggers, coping strategies, and views on algorithmic personalization. Many participants opened up about addiction-like patterns and emotional contradictions, helping us dive beneath the surface of their habits.

References
Berryman, C., Ferguson, C.J. & Negy, C. (2018). Social Media Use and Mental Health among Young Adults.
Dodemaide, P., Merolli, M., Hill, N., & Joubert, L. (2022). Do Social Media Impact Young Adult Mental Health and Well-Being?
Ophir, E., Nass, C., & Wagner, A. D. (2009). Cognitive control in media multitaskers.
Zakon, A. (2019). Optimized for addiction: extending product liability to social media algorithms.

Ethical Considerations
To ensure ethical integrity throughout the research:
✅ Informed Consent: Participants were clearly informed about the study's purpose and gave explicit consent before participating in any part of the research.
🔒 Anonymity & Confidentiality: No personally identifiable information was collected; all data was stored securely and handled responsibly.
🙋♀️ Voluntary Participation: Participants could skip any question or withdraw from the study at any time without penalty.
🧠 Minimized Bias: Questions were carefully phrased to avoid leading or suggestive language.
📄 Non-Required Open-Ended Responses: Participants were allowed to input “N/A” for open-ended questions, respecting individual comfort levels.
📧 Transparent Communication: The study’s academic purpose and expected time commitment were clearly conveyed through the consent form and recruitment messages.
🔐 Secure Data Handling: All collected data was stored on encrypted and password-protected systems accessible only to the research team.

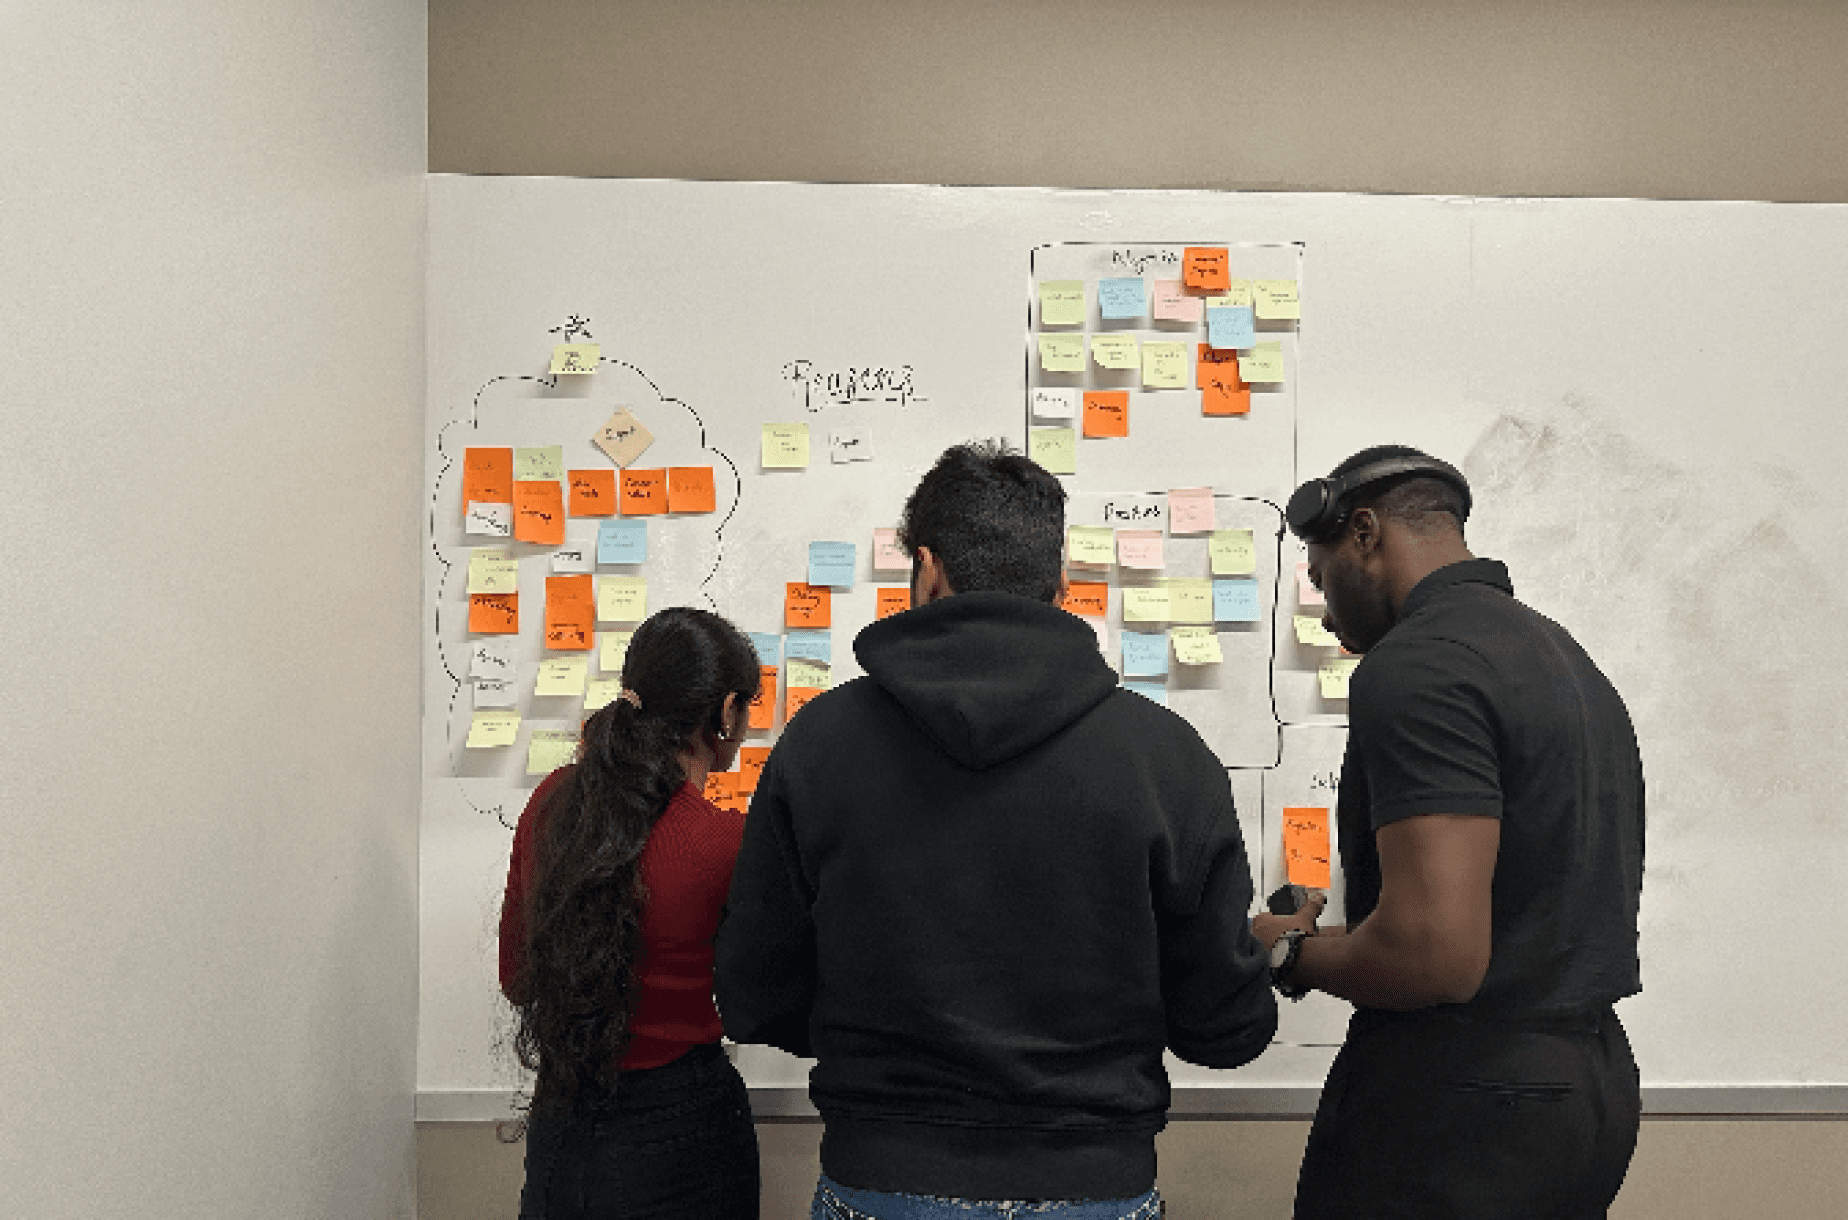
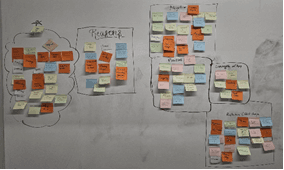
Making Sense of It All
Once data collection was complete, we moved into thematic analysis. We transcribed interviews, created a codebook with 99 initial codes, and collaboratively reduced them to 10 major codes through affinity diagramming.
We organized findings into core themes:
Emotional coping and escapism
Self-evaluation and attempts at regulation
Algorithmic precision vs. loss of control
Side effects like stress, productivity loss, and poor sleep
This phase helped us synthesize user behaviors, motivations, and pain points into actionable insights.
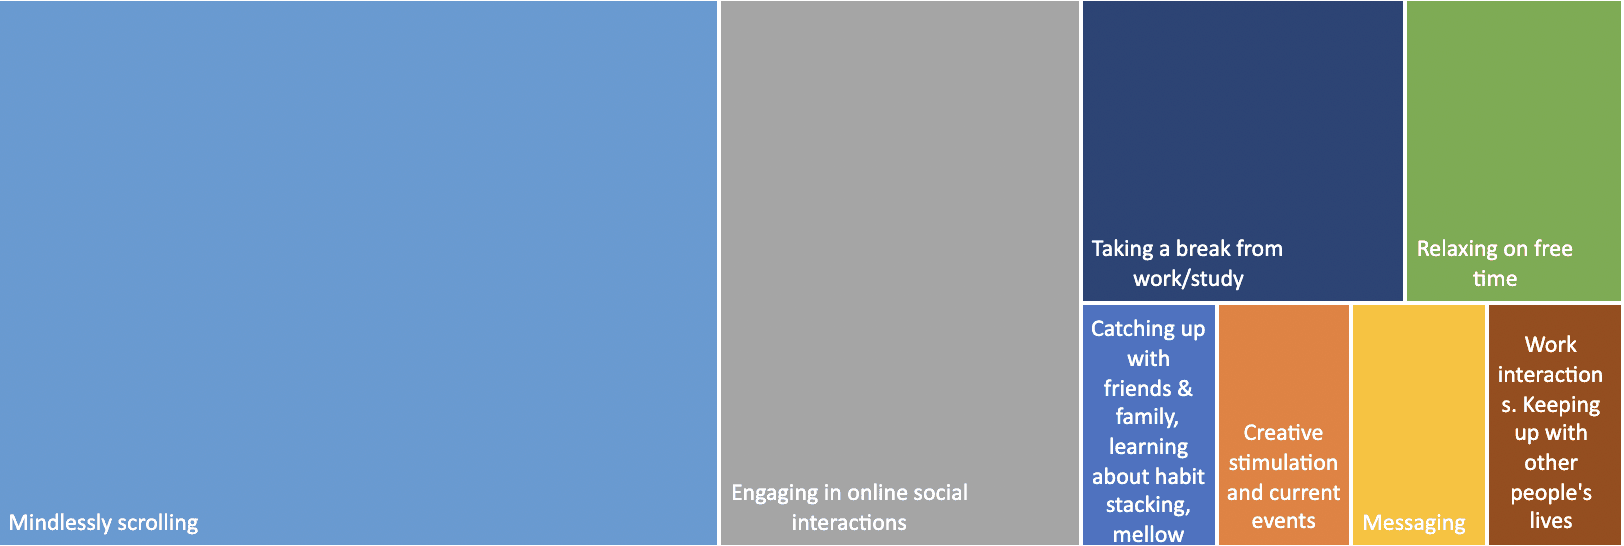
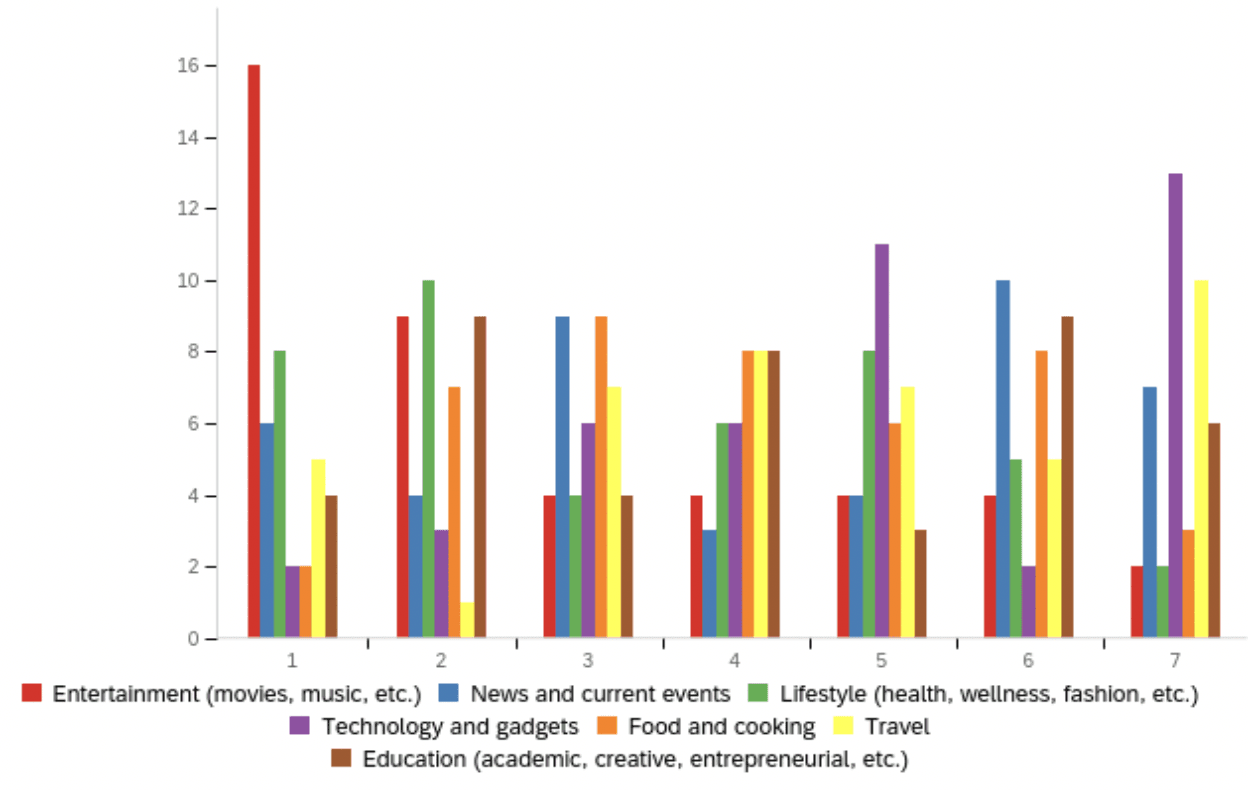
Participant’s primary motivation for social media platform visits
A small snippet on the data collected during diary studies

To support consistent data capture, we provided templated prompts and daily reminders. This setup allowed us to collect 90+ entries across 6 participants.

Some notable quotes from the interviews
“There’s this thing called ‘in-feed syllabus.’ What people are learning, what they’re actively consuming, what they know about — comes from social media. That’s how I get my information too.”
“It’s a good distraction when I need it, and at the same time, it’s a distraction when I shouldn’t be taking one.”
“Currently, I’m dissatisfied [with my social media usage]. I’m using it a lot more just given my situation… It’s become a much bigger distraction, and I’d like to limit myself more.”
“Even when I try to stay off, the algorithm shows me stuff I can’t ignore. It’s like it knows exactly what I’ll click.”
“Political and news content is crafted to make you feel negative… because negative emotions are just easier to trigger.”
Laying the Groundwork
This mixed-methods research study investigates the influence of algorithmically optimized content on the mental health and consumption behaviors of young adults. By combining a diary study, semi-structured interviews, and survey analysis, the study explores emotional responses, behavioral changes, and perceptions of control over social media habits. Findings reveal algorithmic "stickiness," dual emotional impact, and the value of digital self-reflection as both a research and behavior modification tool.
Research Questions
What are the effects of algorithm-optimized social media feeds on the mental health of young adults?
What motivates or hinders social media consumption patterns?
How does user awareness influence attempts to regulate usage?
Summary
This mixed-method UX research explored how
algorithm-optimized social media feeds impact the emotional well-being and digital habits of young adults (ages 21–29).
We conducted a 29-question survey (43 responses),
a 5-day diary study (8 participants, 27 entries),
and semi-structured interviews (6 participants) to uncover patterns in content consumption, emotional triggers, and behavior regulation.
Role, Team and Duration
UX Researcher
Worked with Nicole Bakaitis,
Lem Phan & David Nana Dwomoh Sarpong
Worked under Professor Jina Huh-Yoo
January 2024 - April 2024
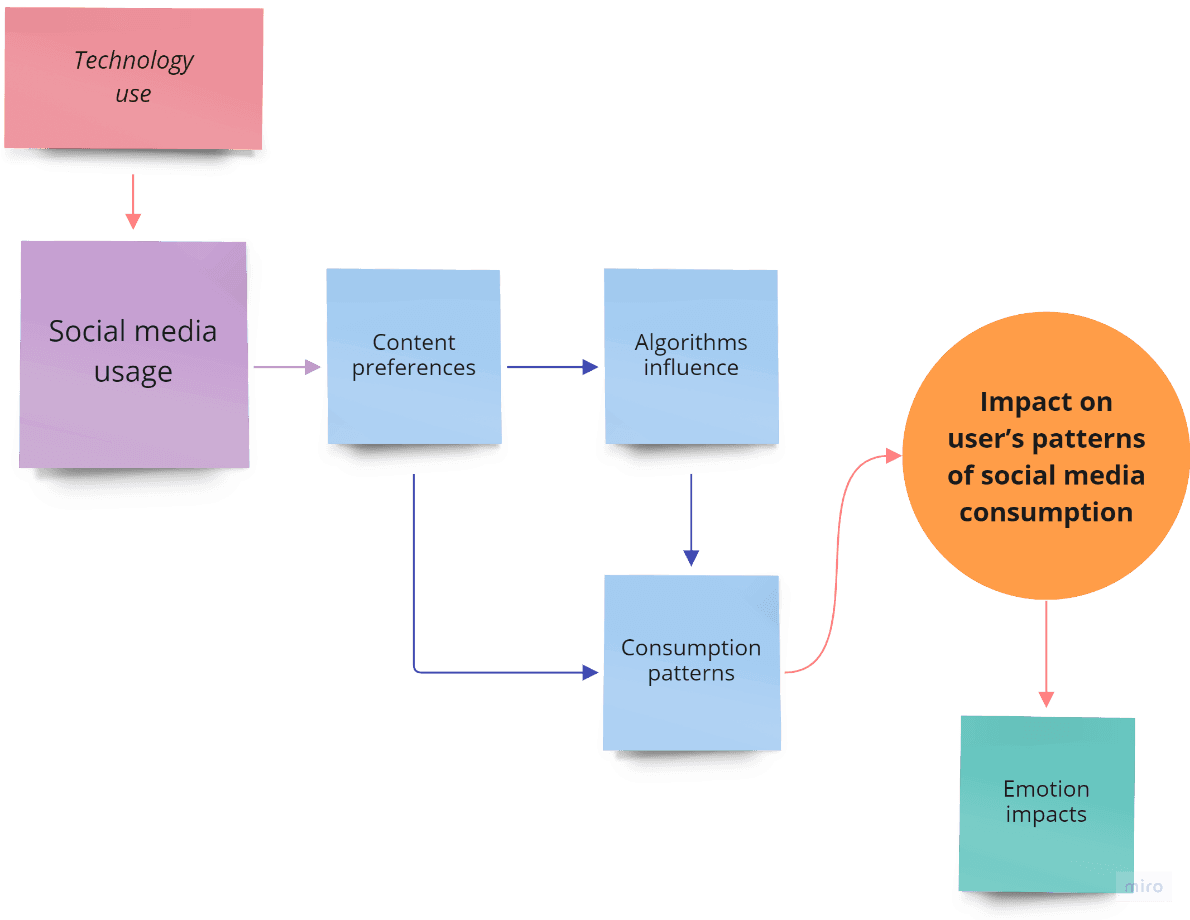

Conceptual map
Stage 1 : Survey
We began by distributing the survey to establish baseline trends across a wider sample.
The 29 questions focused on platform preference, time spent online, emotional impact, behavioral attempts to limit use, and perceptions of algorithmic personalization. The survey revealed key behavioral anchors, such as short-form video consumption, emotional triggers like boredom and anxiety, and growing frustration with intrusive ad content. These insights informed both our diary prompts and interview flow.
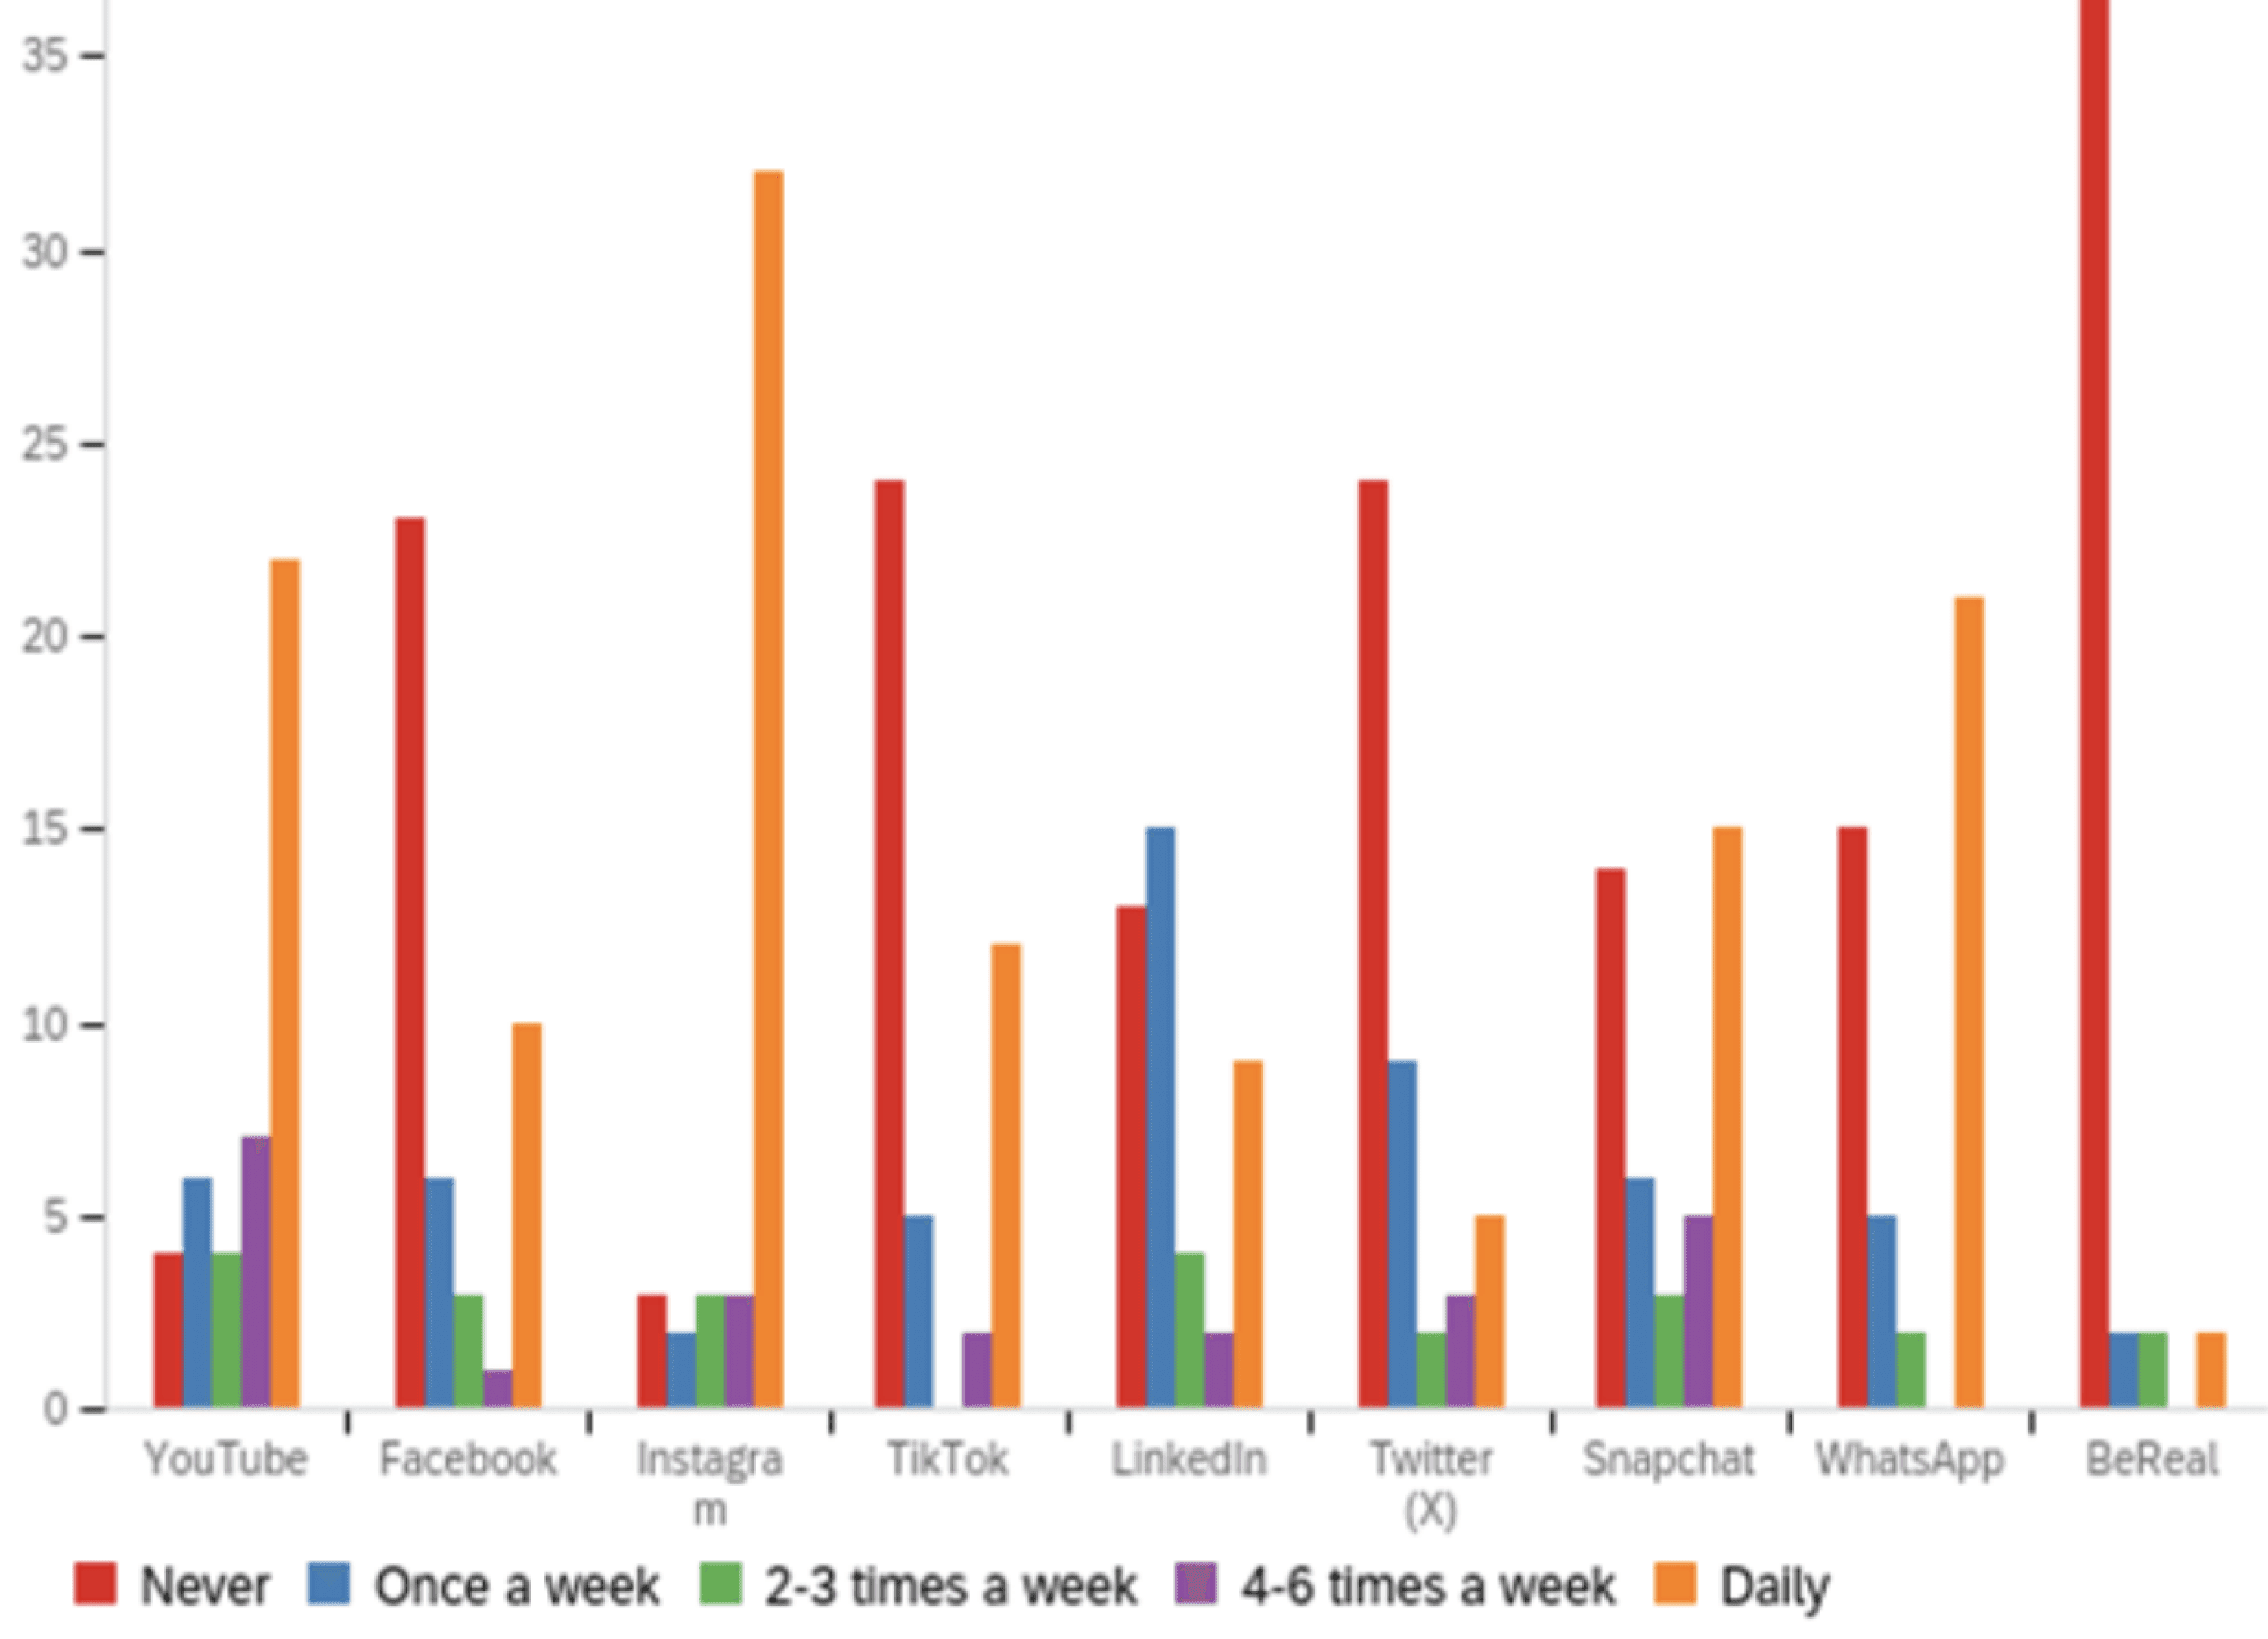

Usage of Social Media Platforms
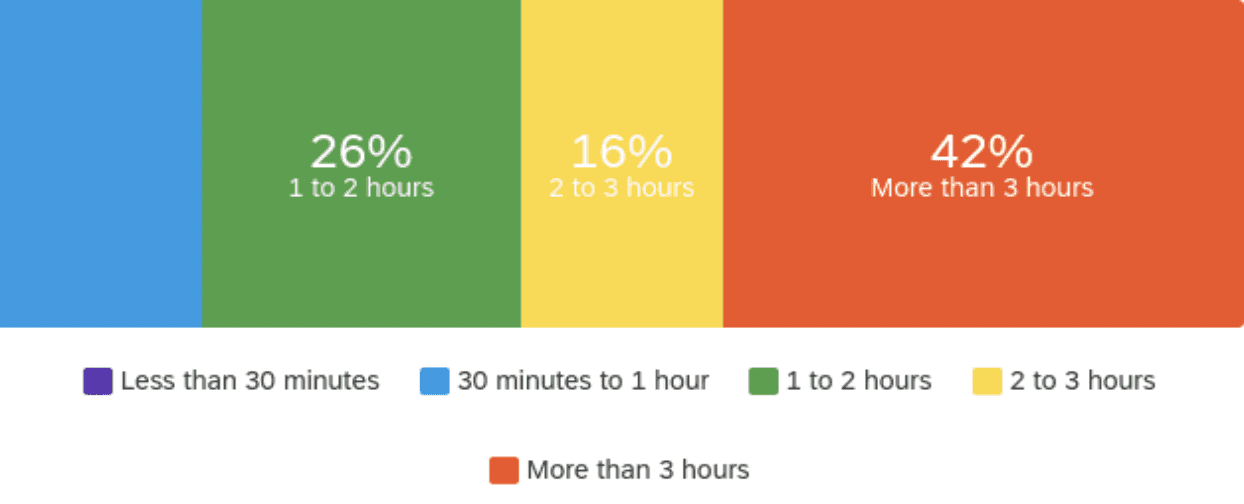

Time they spent on
Social Media Eveyday

Type of content interacted with/viewed on these platforms during last week

Emotional Trigger
(e.g., boredom, anxiety)
Open Social Media
(e.g., TikTok, IG)
Consume Short-Form Content
(memes, reels, news)
Temporary Relief or Escapism
Negative After Effects
(guilt, comparison, fatigue)
Reflection or Awareness
(prompted by journaling)
Attempt to Regain Control
(app limits, breaks)
Content - Emotion Loop: Diary Study Insight

Stage 2: Diary Studies
After analyzing survey data to uncover behavioral anchors, we designed a 5-day diary study to probe deeper into users’ daily emotional states and content engagement patterns. The goal was to understand not just how much time users spent on social media, but why they turned to it in the first place—and how it made them feel throughout the day.
During this phase, we recruited 8 participants and asked them to log daily reflections via Qualtrics. Each diary entry prompted users to detail their platform usage, type of content consumed, emotional state before/during/after, and any efforts made to disengage.

What We Learned
Emotions Drive Use: Emotional states—especially boredom, stress, and anxiety—were powerful motivators for initiating use.
Passive Scrolling = Emotional Drain: Consumption that started as mindless often led to mental fatigue, decreased productivity, and worsened mood.
Awareness Boosted Behavior Change: Many participants altered their habits mid-study, prompted by daily reflections. This suggests that reflective UX tools (e.g., usage journaling, emotional check-ins) could promote healthier digital behaviors.
Algorithm = Emotional Amplifier: Personalized feeds sometimes intensified emotional distress by surfacing similar content repeatedly.

Throughout this study, we explored how young adults engage with social media across emotional, behavioral, and algorithmic dimensions. By combining survey data, diary entries, and interviews, we uncovered how boredom, stress, and personalization shape digital habits and how users actively seek ways to regain control. More than just gathering insights, the process prompted reflection, revealing that even simple tools like journaling can shift awareness. This multi-method approach not only deepened our understanding but also underscored the importance of designing healthier, more intentional digital experiences.

Digital Wellbeing
UX Research
Mixed Methods
Survey Research
Behavioral Design
Diary Study
User Interviews

© 2025 | Designed by Prajna Puthran with ♡ | All Rights Reserved.